Derived outputs in stratified models
In a previous example, we saw how to track derived outputs for a simple, unstratified model. In this example we’ll look into tracking derived outputs for a stratified model.
We’ll be looking at:
Let’s start by defining a reasonably complicated compartmental SEIR model stratified by age and clinical status. This model will have:
An age stratification with strata:
young
old
A “clinical status”” stratification with strata:
asymptomatic: has disease, doesn’t know it, no symptoms
symptomatic: has disease, doesn’t know it (or not tested), symptoms
isolated: has disease, knows it (tested), is isolated at home, symptoms
hospital: has disease, knows it (tested), severse symptoms and in hospital
We’ll use this model as a basis for defining our derived outputs.
[1]
import numpy as np
import matplotlib.pyplot as plt
from summer import CompartmentalModel, Stratification, Multiply, Overwrite

def build_model():
    """Returns a new SIR model"""
    # Create basic SEIR model.
    model = CompartmentalModel(
        times=[0, 20],
        compartments=["S", "E", "I", "R"],
        infectious_compartments=["I"],
        timestep=0.1,
    )
    model.set_initial_population(distribution={"S": 990, "I": 10})
    model.add_infection_frequency_flow(name="infection", contact_rate=2, source="S", dest="E")
    model.add_transition_flow(name="incidence", fractional_rate=0.5, source="E", dest="I")
    model.add_transition_flow(name="recovery", fractional_rate=0.3, source="I", dest="R")
    model.add_death_flow(name="infection_death", death_rate=0.05, source="I")

    # Stratify by age.
    age_strat = Stratification('age', ['young', 'old'], ['S', 'E', 'I', 'R'])
    age_strat.set_population_split({'young': 0.5, 'old': 0.5})
    model.stratify_with(age_strat)

    # Stratify by clinical status for infected people.
    strata = ['asymptomatic', 'symptomatic', 'isolated', 'hospital']
    clinical_strat = Stratification('clinical', strata, ['I'])
    clinical_strat.set_population_split({'asymptomatic': 1, 'symptomatic': 0, 'isolated': 0, 'hospital': 0})

    # Half of young people become asymptomatic.
    young_incidence_adjustments = {
        "asymptomatic": Multiply(0.4),
        "symptomatic": Multiply(0.3),
        "isolated": Multiply(0.2),
        "hospital": Multiply(0.1),
    }
    clinical_strat.set_flow_adjustments(
        "incidence",
        young_incidence_adjustments,
        source_strata={'age': 'young'}
    )

    # A higher proporiton of old people go to hospital
    old_incidence_adjustments = {
        "asymptomatic": Multiply(0.3),
        "symptomatic": Multiply(0.3),
        "isolated": Multiply(0.2),
        "hospital": Multiply(0.3),
    }
    clinical_strat.set_flow_adjustments(
        "incidence",
        old_incidence_adjustments,
        source_strata={'age': 'old'}
    )

    # Adjust risk of dying given clinical status
    clinical_strat.set_flow_adjustments("infection_death", {
        "asymptomatic": Overwrite(0),  # Can't die if no symptoms
        "symptomatic": None,
        "isolated": None,
        "hospital": Multiply(2),  # Severe cases go to hospital
    })

    # Adjust infectiousness given clinical status
    clinical_strat.add_infectiousness_adjustments("I", {
        "asymptomatic": Multiply(0.5),
        "symptomatic": None,
        "isolated": Multiply(0.2),
        "hospital": Multiply(0.1),
    })
    model.stratify_with(clinical_strat)

    return model

def plot_outputs(model, names, title, ylabel):
    """Plot a derived output for a model"""
    fig, ax = plt.subplots(1, 1, figsize=(12, 6), dpi=120)
    for name in names:
        ax.plot(model.times, model.derived_outputs[name])
    ax.set_title(title)
    ax.set_xlabel("Days")
    ax.set_ylabel(ylabel)
    start, end = ax.get_xlim()
    ax.legend(names, loc='upper left')
    ax.xaxis.set_ticks(np.arange(start + 1, end, 5))
    plt.show()
Now that we have a model that we can inspect, let’s use the derived output requests from our previous example to calculate some quantities of interest.
Tracking cumulative deaths by age group
We can use a flow output plus a cumulative output to track the cumulative number of people who have died from the disease, segmented by age group:
[2]
model = build_model()

age_strata = ["young", "old"]
output_names = [f"death_{s}" for s in age_strata]
for age_stratum, output_name in zip(age_strata, output_names):
    model.request_output_for_flow(
        output_name,
        flow_name="infection_death",
        source_strata={"age": age_stratum}
    )
    model.request_cumulative_output(f"cum_{output_name}", output_name)


model.run()
cum_output_names = [f"cum_{o}" for o in output_names]
plot_outputs(model, cum_output_names, "Cumulative deaths by age group", 'Cumulative deaths')

Tracking disease incidence
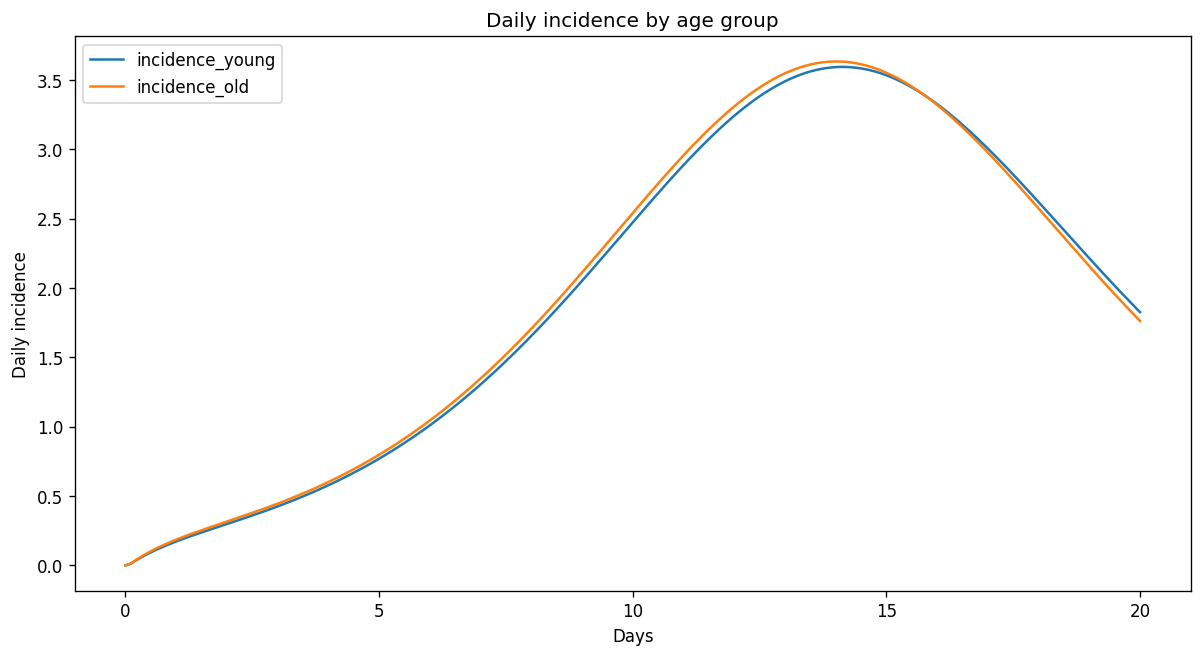
We can use a flow output to track the number of people who progress from exposed to infected per day (‘incidence’) and break it down by either age group, severity, or both.
To start, let’s look at incidence (daily flow from E to I), by age group:
[3]
model = build_model()

age_strata = ["young", "old"]
output_names = [f"incidence_{s}" for s in age_strata]
for age_stratum, output_name in zip(age_strata, output_names):
    model.request_output_for_flow(
        output_name,
        flow_name="incidence",
        source_strata={"age": age_stratum}
    )

model.run()
plot_outputs(model, output_names, "Daily incidence by age group", 'Daily incidence')
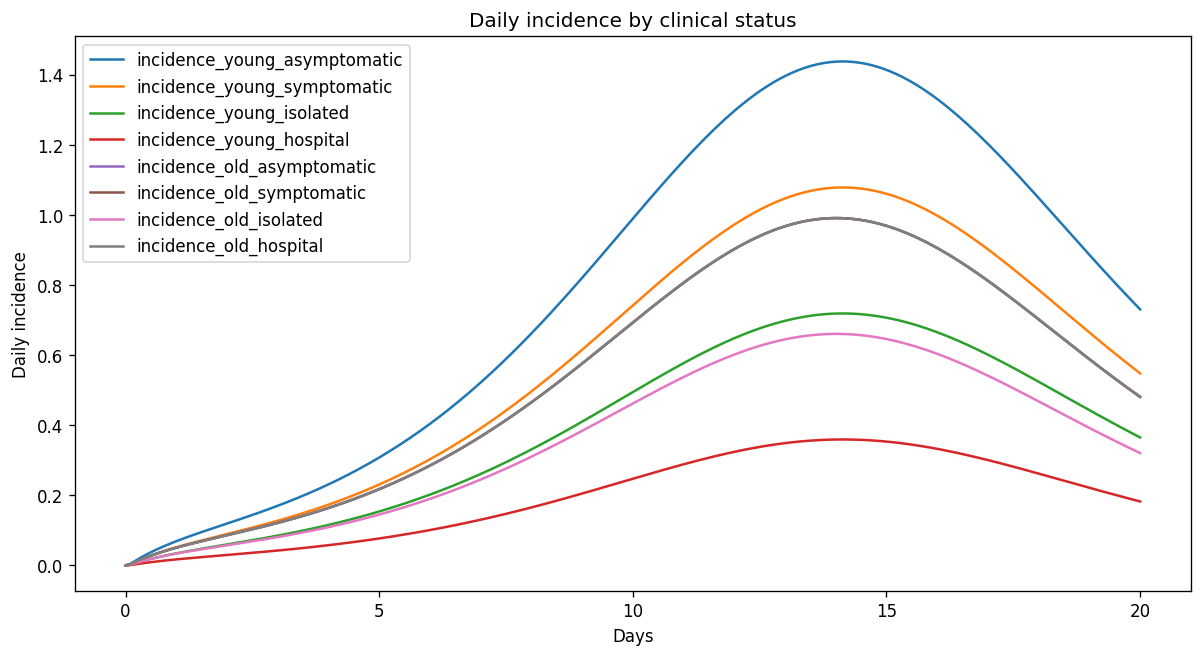
We can also inspect incidence by clinical status
[4]
model = build_model()

clinical_strata = ["asymptomatic", "symptomatic", "isolated", "hospital"]
output_names = [f"incidence_{s}" for s in clinical_strata]
for clinical_stratum, output_name in zip(clinical_strata, output_names):
    model.request_output_for_flow(
        output_name,
        flow_name="incidence",
        dest_strata={"clinical": clinical_stratum}
    )

model.run()
plot_outputs(model, output_names, "Daily incidence by clinical status", 'Daily incidence')

Finally, we can get a break down of incidence by both age AND clinical status.
[5]
from itertools import product

model = build_model()

age_strata = ["young", "old"]
clinical_strata = ["asymptomatic", "symptomatic", "isolated", "hospital"]
strata = list(product(age_strata, clinical_strata))
output_names = [f"incidence_{a}_{c}" for a, c in strata]

for (age, clinical), output_name in zip(strata, output_names):
    model.request_output_for_flow(
        output_name,
        flow_name="incidence",
        dest_strata={"clinical": clinical, "age": age}
    )

model.run()
plot_outputs(model, output_names, "Daily incidence by clinical status", 'Daily incidence')
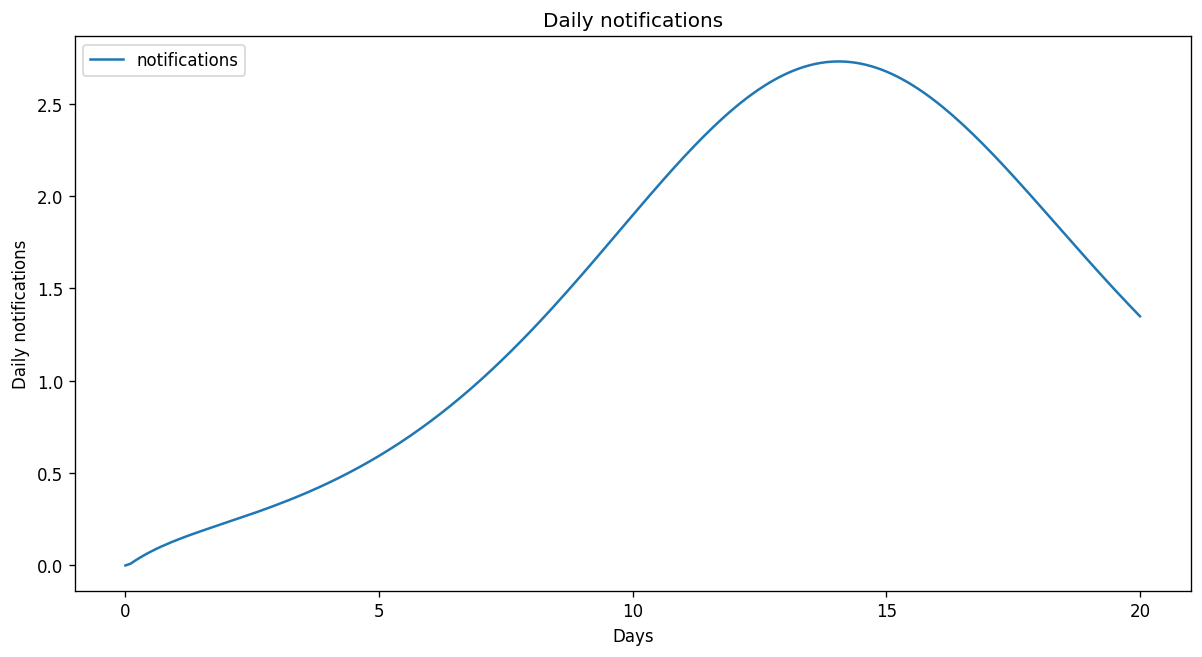
Tracking daily notifications
We could use the same approach to track “notifications”: disease incidence that is detected via testing. In our (simplified) clinical status strata, we could define notifications as:
asymptomatic: no notification
symptomatic: no notification
isolated: notification
hospital: notification
Given this definition, notifications can be calculated as follows:
[6]
model = build_model()

# Step 1: Get model to track the incidence flows for the notification strata
notify_strata = ["isolated", "hospital"]
output_names = [f"incidence_{s}" for s in notify_strata]
for notify_strata, output_name in zip(notify_strata, output_names):
    model.request_output_for_flow(
        output_name,
        flow_name="incidence",
        dest_strata={"clinical": notify_strata}
    )

# Step 2: Aggregate the notification strata
model.request_aggregate_output(
    name="notifications",
    sources=output_names,
)

model.run()
plot_outputs(model, ["notifications"], "Daily notifications", 'Daily notifications')
Tracking hospital occupancy
We can use a compartmental output to track the number of infected people who are in the hospital strata per timestep.
[7]
model = build_model()

model.request_output_for_compartments(
    'hospital_occupancy',
    compartments=["I"],
    strata={"clinical": "hospital"}
)

model.run()
plot_outputs(model, ["hospital_occupancy"], "Hospital occupancy", 'Number of patients')

Summary
Now you know how to request derived ouputs that target specific strata in a stratified model.
[ ]