Installation and Quickstart
This page will explain how to get started using the Summer library in your own project. If you would like to setup Summer as a contributor, or to run the code examples, use these instructions instead.
Prerequisites
This library uses numerical computing packages such as NumPy, SciPy and Numba, which can be difficult to install on Windows and MacOS. As such, we recommend that you use the Anaconda Python distribution to install and run Summer. You can install a minimal Anaconda distribution (“Miniconda”) here.
In any case, you will need to have Python 3.6+ and Pip (the Python package manager) available.
If you are using Miniconda, then you will need to create an “environment” where you can install Summer and other packages you need for your project. You can create a new environment as follows:
# Create a new Anaconda environment.
conda create -n myprojectname python=3.6
# Make the new Anaconda environment active in your shell session.
conda activate myprojectname
Installation
You can install summer from PyPI using the Pip package manager
pip install summerepi
Then you can import the library as summer and get started building compartmental disease models. You can find a list of examples and detailed API documentation on this site.
Note the above method installs the latest ‘release’ version of summer, but that this documentation is based on the current Github master version of summer, which may contain new features or changes to the API. To install summer directly from Github, use the following command instead
pip install git+https://github.com/monash-emu/summer.git
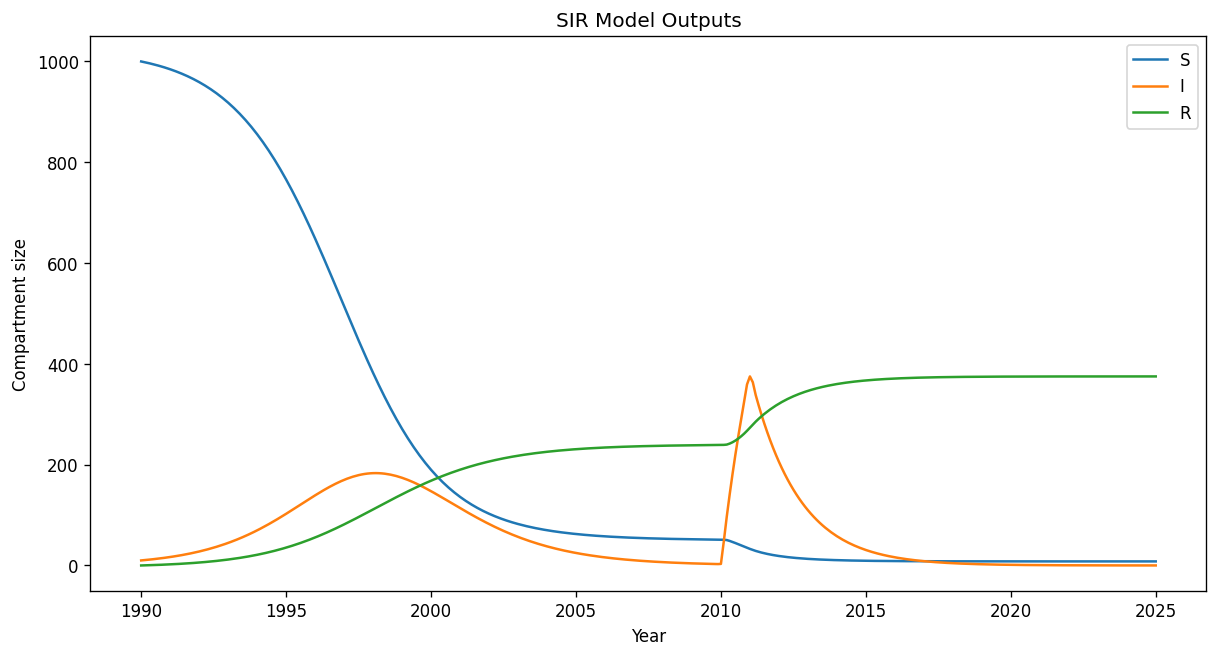
Quick Example Model
This is a short example on how summer can be used. See the list of examples for more.
[1]
import matplotlib.pyplot as plt

from summer import CompartmentalModel

# Create a model.
model = CompartmentalModel(
    times=[1990, 2025],
    compartments=["S", "I", "R"],
    infectious_compartments=["I"],
    timestep=0.1,
)

# Add people to the model.
model.set_initial_population(distribution={"S": 1000, "I": 10})

# Add intercompartmental flows.
model.add_infection_frequency_flow(name="infection", contact_rate=1.2, source="S", dest="I")
model.add_transition_flow(name="recovery", fractional_rate=1/6, source="I", dest="R")
model.add_death_flow(name="infection_death", death_rate=0.5, source="I")

# Spice up the model by importing 500 infected people over the course of 2010.
def get_infected_imports(t, cv=None):
    return 500 if 2010 < t <= 2011 else 0
model.add_importation_flow('infected_imports', get_infected_imports, 'I', split_imports=True)

# Run the model
model.run()

# Plot the model results.
fig, ax = plt.subplots(1, 1, figsize=(12, 6), dpi=120)
for i in range(model.outputs.shape[1]):
    ax.plot(model.times, model.outputs.T[i])

ax.set_title("SIR Model Outputs")
ax.set_xlabel("Year")
ax.set_ylabel("Compartment size")
ax.legend(["S", "I", "R"])
plt.show()
[ ]